Grid
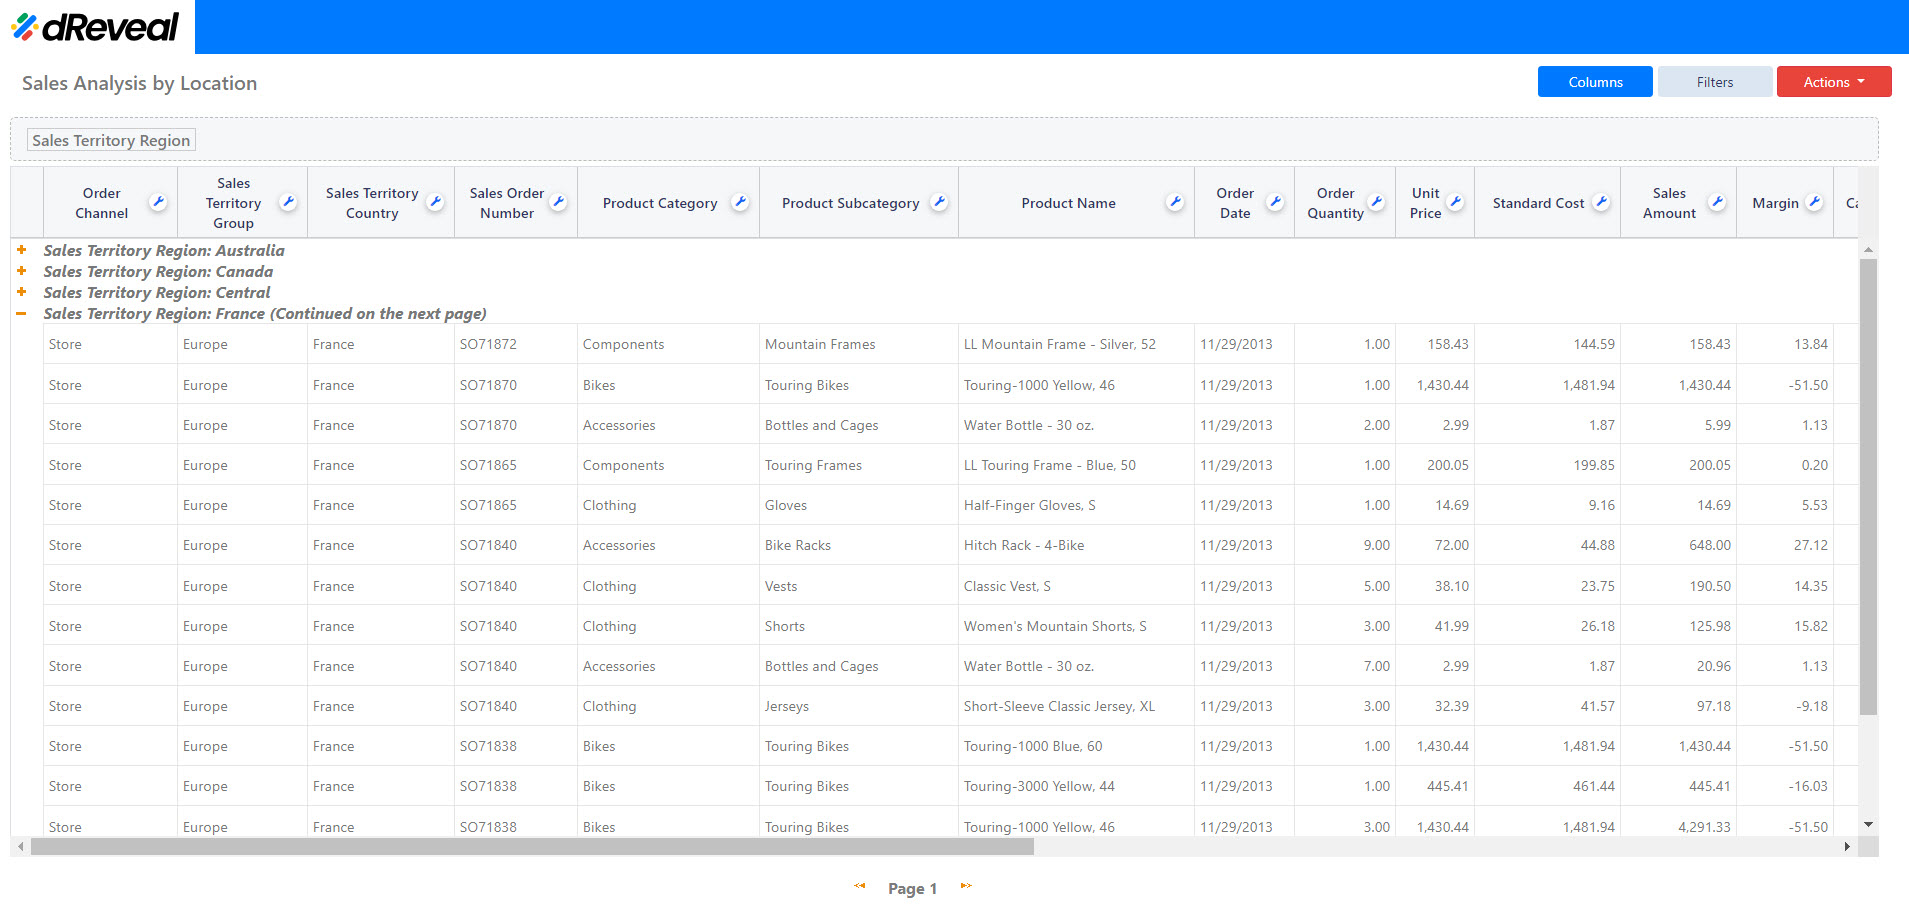
GRID Reports in dReveal offer users a structured and tabular representation of data, allowing for a clear and organized view of information. This format presents data in columns and rows, resembling a traditional spreadsheet layout.

The core idea behind grid reports is to provide a concise yet comprehensive display of data, making it easy for users to quickly scan and analyze information.
Users can dynamically manipulate the data within the grid to suit their specific needs. Including some main functionalities such as:
-
Sorting: Users can sort columns in ascending (A to Z or lowest to highest value) or descending (Z to A or highest to lowest value) order. This is useful for: Identifying top-spending customers. Arranging products by price to analyze the most profitable ones. Finding the dates of the most recent transactions.
-
Grouping: By grouping data by categories (e.g., region, product, or customer), users can: Compare the performance of different regions. Analyze sales by product category. Identify the most active customers in each segment.
-
Column Selection: The ability to select and hide columns allows users to: Create customized views for different analyses. Remove columns that are not relevant to the task at hand. Organize columns logically for easier reading.
-
Pagination: Pagination divides data into smaller pages, which is especially useful for: Handling large datasets without overloading the interface. Finding specific records more efficiently.
-
Exporting: Exporting data to Excel allows users to: Perform more complex analyses using Excel's powerful functions. Create custom reports and presentations. Share data with other users who do not have access to the reporting tool.
-
Freezing: By freezing rows or columns, users can: Keep column headers or row names always visible. Facilitate data comparison between different sections of the grid.
-
Conditional Formatting: Conditional formatting is used to visually highlight data that meets certain conditions, such as: Highlighting sales that exceed a certain threshold. Identifying customers with overdue payments. Visualizing positive or negative trends in the data.
-
Summarization: Totals and subtotals allow users to: Get a quick overview of the data. Compare the results of different groups. Identify individual contributions to overall totals.
